Introducing the Qualitrix T.R.U.S.T.™ Framework: A New Blueprint for Trusted Digital & AI Systems
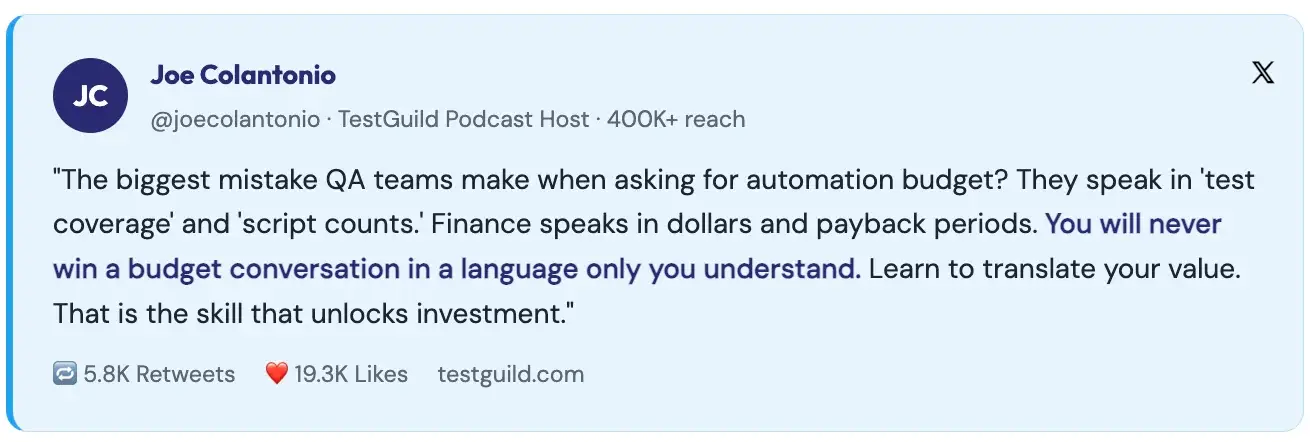
Most test automation business cases fail before they reach the CFO’s desk. Not because the numbers are wrong, but because the numbers are framed around testing metrics nobody outside the QA team cares about.
Coverage percentages. Defect counts. Test execution time. These mean nothing to a finance director deciding whether to approve a ₹40 lakh or $200,000 investment. What they care about is simple: what does this cost, what does it return, and when?
This article gives you the framework to answer those three questions with real benchmarks, an honest calculation method, and the framing that moves decisions.
The typical test automation pitch goes something like this: “We currently run 400 manual test cases per release. Each takes 10 minutes. That’s 67 hours of manual testing per release. If we automate 80% of them, we save 53 hours per release at ₹800/hour, saving ₹42,400 per release.”
It’s not wrong. It’s just not persuasive to anyone who doesn’t already believe in automation.
The CFO’s first question will be:
“How much does the automation cost to build and maintain?”
The second will be: “What happens to those 53 hours – do we reduce headcount, or do we just redeploy the same people?”
If the answer to the second question is “the team stays the same size,” the labour-saving argument collapses.
The business case that gets approved doesn’t lead with saved testing hours. It leads with business risk and business velocity.
Before you pitch what automation will save, document what the absence of automation is currently costing. This is the loss-framing approach, and it is dramatically more persuasive than gain-framing for budget decisions.
Specifically, document three numbers:
When you add these three together, the question stops being “can we afford test automation?” and becomes “can we afford not to have it?”
Forrester Research’s Total Economic Impact study on test automation found that mature automation programmes deliver a 4.5× ROI over three years. That number has become the industry benchmark because it holds across industries and team sizes when the programme is run correctly.
The breakdown typically looks like this:
The critical word is “mature.” Teams that abandon automation within 18 months, and 68% do, according to VirtuosoQA’s 2025 analysis, never reach Year 2. The business case needs to account for this honestly: the ROI model only holds if the programme is maintained. That means budgeting for maintenance from day one, not discovering it as a surprise cost in Month 6.
Here is the formula:
ROI (%) = [(Total Savings − Total Automation Cost) ÷ Total Automation Cost] × 100
Total Savings includes:
Total Automation Cost includes:
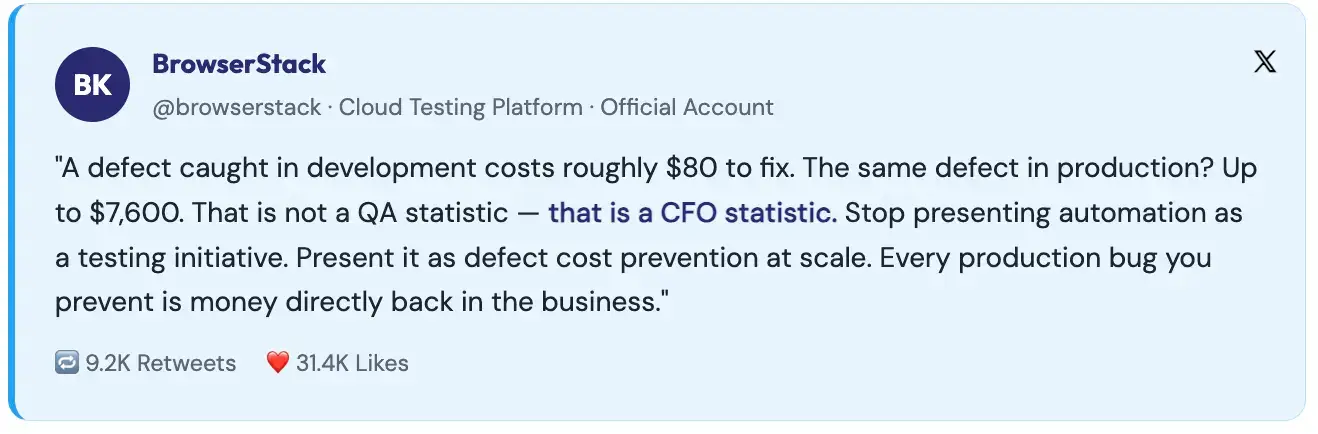
The most common mistake is calculating savings correctly and underestimating costs. Maintenance is the number that breaks ROI models. A suite covering 500 test cases against a product that releases fortnightly will require 10–20 hours per sprint in selector updates, environment fixes, and flaky test remediation. That is a real cost that must appear in your model.
The frustration with poorly framed automation business cases is a consistent theme among senior QA practitioners.
Automation consultant Angie Jones has written and spoken extensively about the gap between how automation is sold internally and what it actually delivers: teams promise speed and coverage, then deliver maintenance overhead and false confidence.
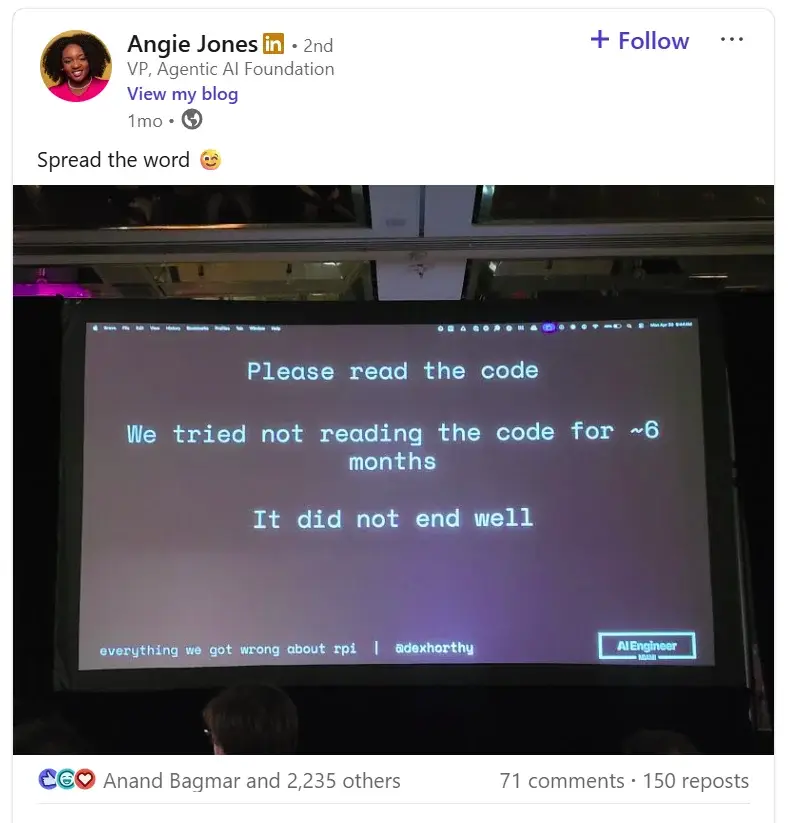
Her core argument that automation ROI requires treating test code with the same engineering rigour as production code directly addresses why so many business cases collapse in Year 1
For a practical walkthrough, Ragjav shares an ROI calculation template for automation testing on his YouTube channel “Automation Step-by-Step”
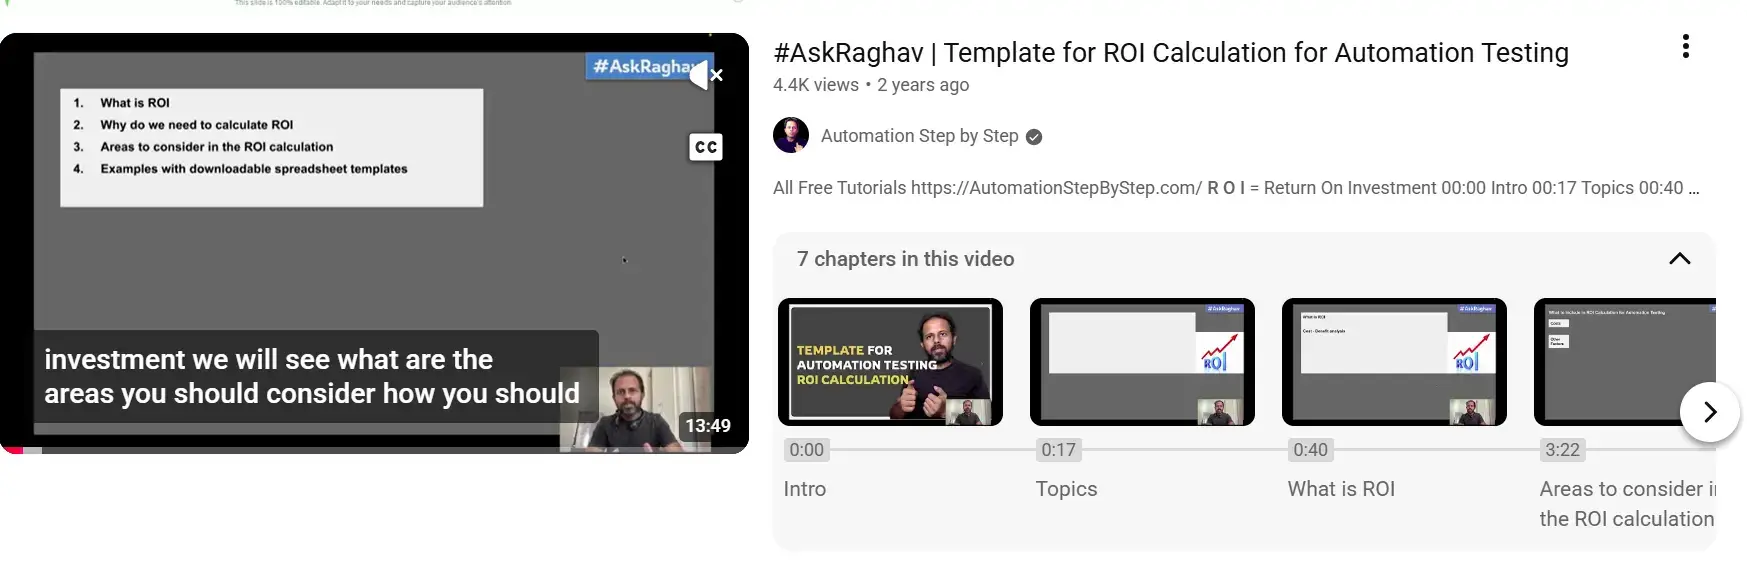
It is one of the more credible treatments of this topic because it doesn’t assume automation always wins; it shows the conditions under which it does and doesn’t.
Another example is Dave Farley’s channel, Modern Software Engineering, which makes the point that automation ROI is fundamentally a function of release frequency: the more often you release, the faster the payback period.
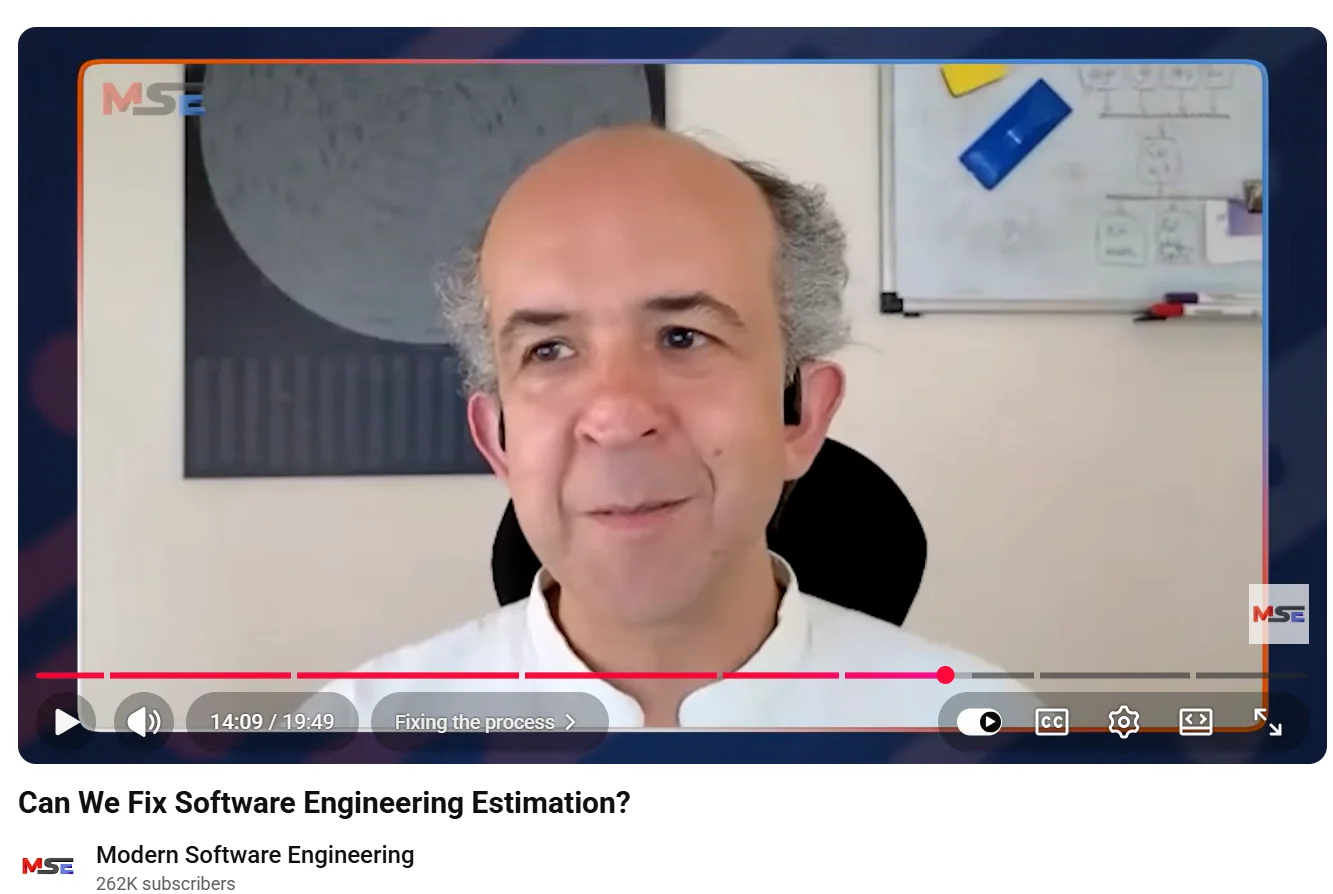
A team releasing weekly gets 52 regression cycles per year from their automation suite. A team releasing quarterly gets 4. The same suite has radically different ROI profiles depending on that one variable.
When you take this to a CFO or CTO, structure it in this order:
First: Here is what our current QA gaps are costing us in business terms – production incidents, release delays, compliance exposure.
Second: Here is what automation addresses specifically, with a conservative three-year model showing Year 1 investment, Year 2 return, and Year 3 compounding.
Third: Here is what a failed implementation looks like and why ours won’t fail: a specific plan for maintenance budgeting, team capability, and framework choice.
Fourth: Here is the decision we need from you: a specific budget number, a specific headcount ask, or a specific tool approval.
The business cases that fail ask for approval of a concept. The ones that get approved ask for a specific decision with specific numbers attached.
Test automation ROI is real. The 4.5× three-year benchmark is achievable. But it requires a business case built on business outcomes, not testing metrics and a realistic model that includes maintenance costs from day one.
The teams that succeed are not the ones who automate the most. They are the ones who automate the right things, maintain them deliberately, and connect their automation programme directly to the business outcomes their leadership team is already measured on.
Build your case around those connections, and budget approval becomes a significantly easier conversation.
If you’re building a business case for test automation investment, our QE specialists can help you nail this down. Get in touch!
Successfully led numerous startups and corporations through their digital transformation
Error: Contact form not found.
Error: Contact form not found.